Visualizing 2.5 Years of Lifting Weights
2021-06-28
I signed up for the weightlifting PE class my first quarter at MIT, and so began my journey of doing exercises other than dumbbell bicep curls. I’ve been squatting, benching, and deadlifting ever since, and it’s been a pretty fun ride. In addition to feeling stronger and establishing a reliable therapeutic outlet, I feel generally happier and more confident when I’ve been lifting well and consistently.
Anyway, faux-motivational preamble aside, I’m writing this post because these few years of lifting have also given me lots of data to parse. I track pretty much every exercise I do in every workout, particularly the big compound lifts, since (1) knowing what you did earlier is important to decide your future training, and (2) progress can be uniquely tangible and satisfying when you make a data visualization out of it.
Tracking lifts might sound exhausting, but it’s actually not that bad. I have a folder on my phone’s Notes app called “Lifting”, and I create a new entry for each workout. During rest periods, I write down how much weight I moved for a particular exercise, along with the rep count and number of sets. Then, periodically, I log the data for the compound lifts in a Google Sheet, which I can then export as CSV and parse in a Jupyter Notebook. The code, and my data, are available here, so you can get a sense of what the data format looks like and how I process it (please don’t expect my code to be pretty, or even parseable).
Like most recreational lifters, I rarely actually do single-rep sets; most of my working sets are in the 3-8 rep range. So, the quantity that I plot in these graphs here is the estimated one-rep max based on the number of reps I actually did. I take a workout, say one where I did 3 sets of 295 lbs for 5 reps on the deadlift, and then I then use a 1-rep max calculator to convert this to a single value. The multiplier for 5 reps is 1.15, so 295 for 5 reps corresponds to a 1RM estimate of 339 (the multiplier for 3 reps is 1.08, and 8 reps is 1.25).
Finally, let’s look at some data! Here’s a birds-eye view plot that shows my progress on the squat, bench, deadlift, and overhead press (OHP) since Jan 2019 (I started these exercises around Sep 2018, but with super beginner weights that I didn’t track). Note that I didn’t have gym access between Sep-Nov 2020 and Jan-Feb 2021 due to COVID, so I couldn’t really do compound lifts. For March-Sep 2020, I was lifting in the home gym that I worked to assemble with my brother, while living back in San Jose, CA at my parents’ house. Since March 2021 I’ve been able to use MIT’s Z center gym again.
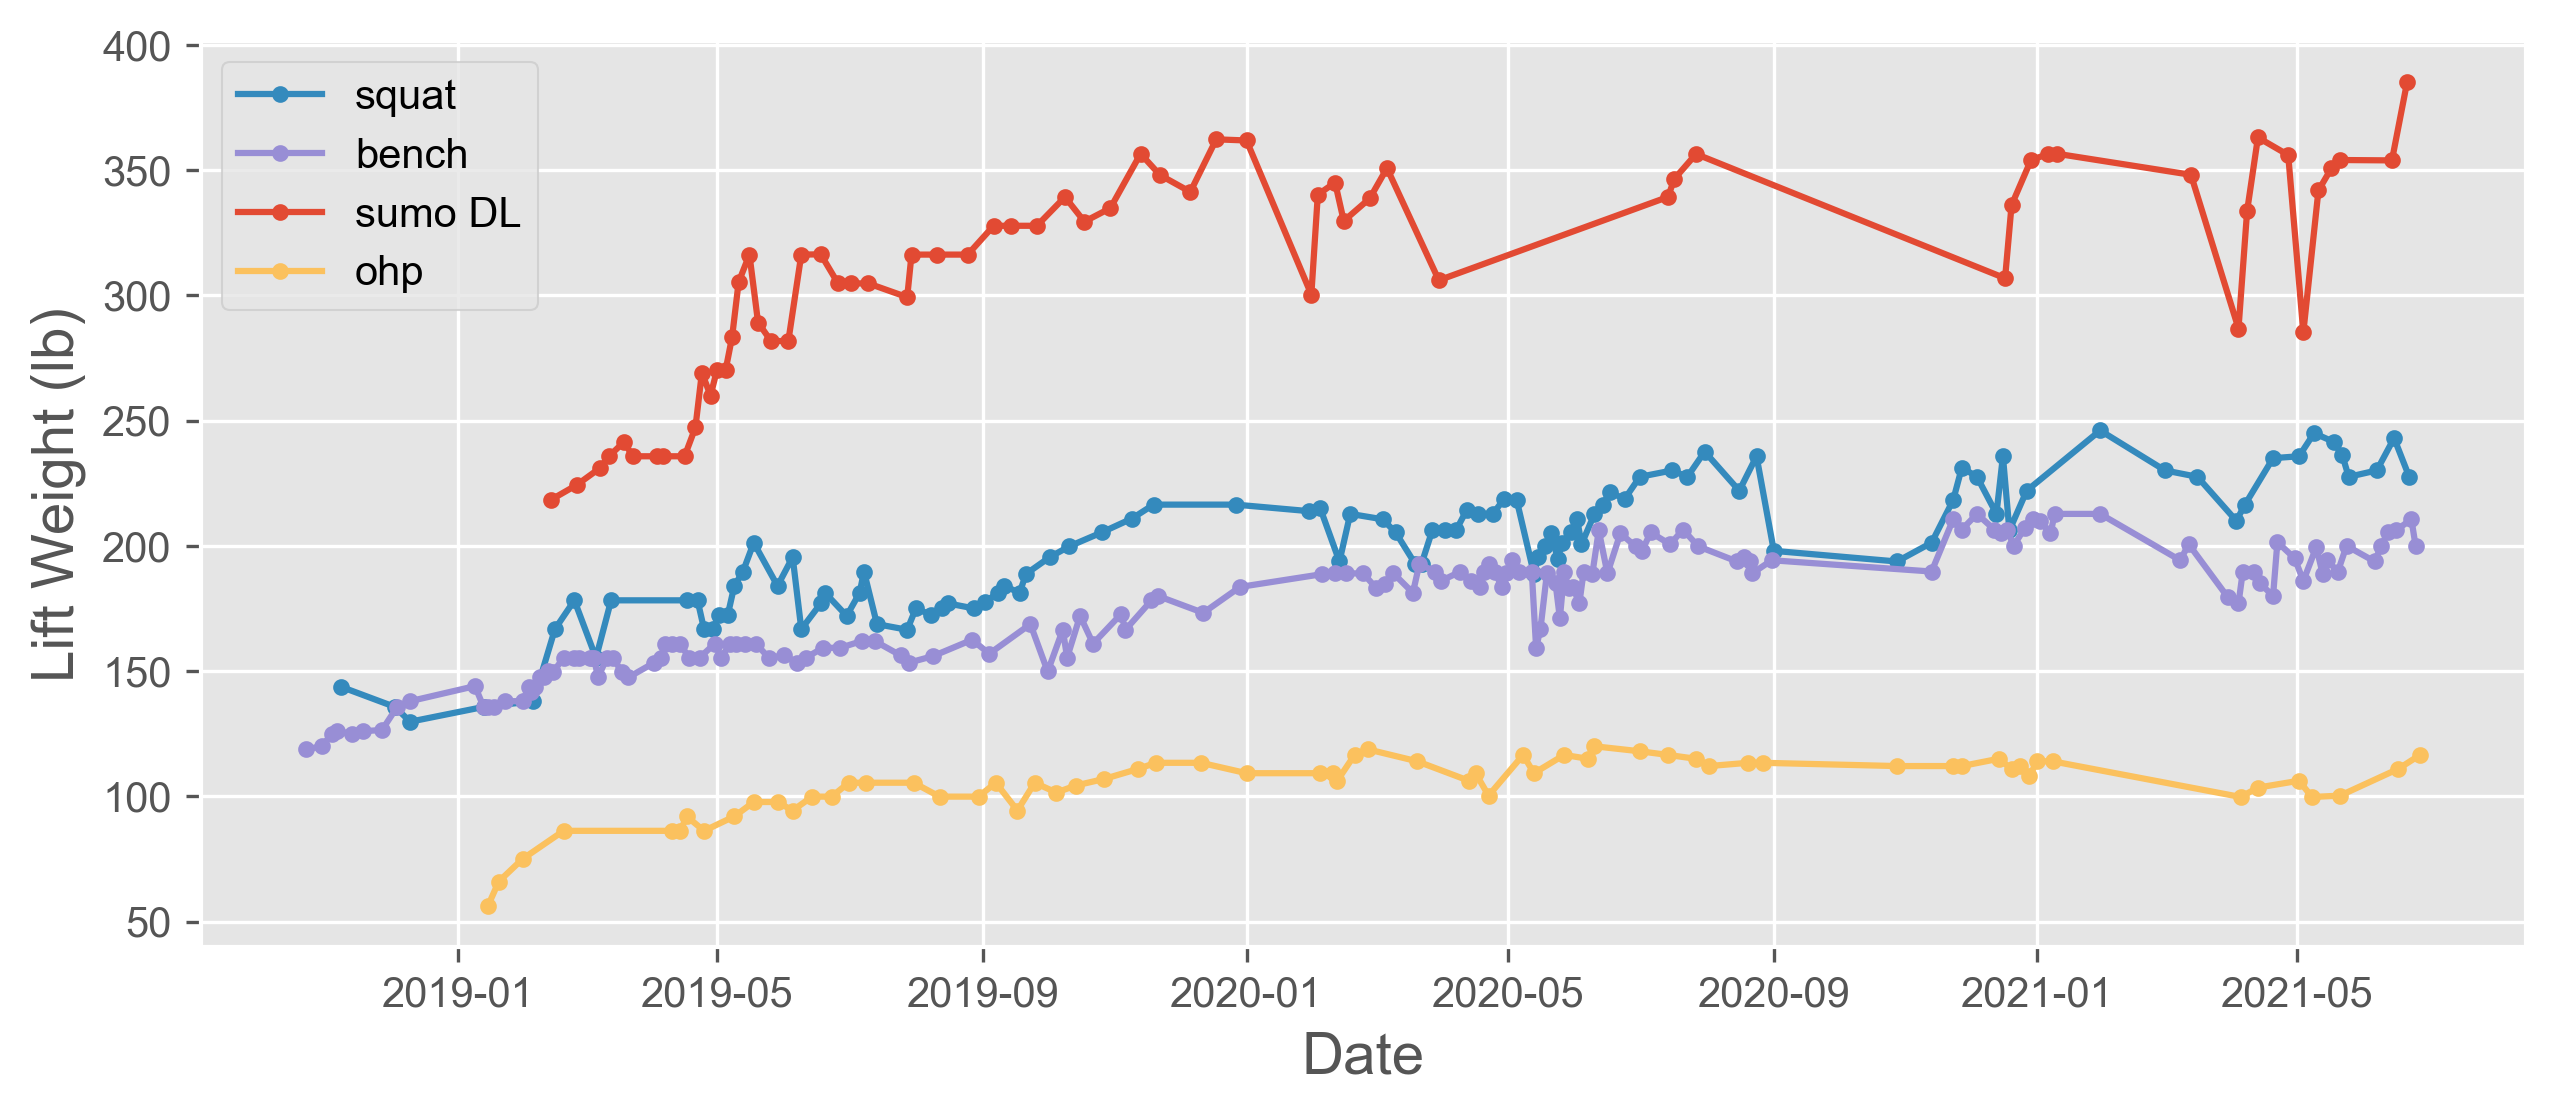
As expected, I’ve made great progress on the big 3 lifts. However, the timing of this progress has been super asymmetric. Breaking down each lift:
- For the sumo deadlift (red), I made incredible progress the spring of my freshman year, which was when the movement started to feel comfortable as my form solidified. By summer 2019 (~half a year into lifting), I was already around a 315-ish max (“three plates”), and I’ve managed to put on around 70 pounds up to 385 since then. For a while, I was making steady progress up to about 355, until some knee issues started to bother me. I switched to conventional deadlifts for a long time, including most of quarantine, because of the knee problems, and because I felt that my lower back needed some more work (conventional deadlift has higher lower back activation, while sumo deadlifting has higher quad activation; both have significant glute + hamstring involvement). However, I’m much stronger with sumo (I have some ape-like length in my arms and legs), so I eventually switched back. After reacclimating in the last few months, I’m starting to hit big weights again, including a 20 lb PR last week.
- On the squat (blue), progress has been slow, but consistent. I’ve brought my squat up from basically 1 plate (135 lbs) up to about 250 now, and that’s been a long road. I made a lot of progress running the nSuns program, which has you do a ton of volume and a heavy max top set every week -- that’s the consistent upward slope from about 2019-09 to 2019-11. The knee issues also slowed down my squat progress in early 2020, and I also couldn’t do much heavy lower body work without a gym. But the home setup and now the MIT gym have allowed me to get back into things. Regardless, my squat is still pretty awful compared to my deadlift/bench and it’s going to take a lot of work to get it up to a reasonable number. The goal is 315 by end of summer, which is extremely ambitious but hopefully doable with an intense program.
- Progress has also been consistent on the bench (purple). The difference is that, as a vain male that primarily cares about upper body size, I’ve benched appreciably more than squat or deadlift (at least 154 bench sessions compared to 103 squat and 78 deadlift sessions since Jan 2019). Also, I’ve never dealt with any upper body issues, compared to several minor injuries/lingering pains in my lower body. So, by now, I have a fairly respectable bench, with around a 215 max at my ~140 lb bodyweight.
- The OHP (orange), meanwhile, has been extremely slow. By early 2020, I had worked my way up to being pretty comfortable with working sets at 95 lbs (1RM of somewhere around 115-120), and I basically haven’t moved since then. I’ve OHP’d 65 times, which is less than the other lifts, and I tend to prioritize volume over improving strength on this exercise. That said, having spent almost 2 years doing reps at 95 lbs, I’d like to finally give this exercise some attention to move up at least a bit.
As mentioned, that first plot only shows the predicted 1RM of the hardest working set I did on a given day. However, sometimes I would make progress by adding set volume, e.g. doing 2 sets at a weight I could previously only do for 1 set. But that previous plot doesn’t show how many sets I was doing at a predicted 1RM. In these below plots, I use point color to show how many sets I completed. For example, a recent workout where I squatted 210 for 2 sets of 5 reps would correspond to an orange point at a 210*1.15 = 241 lb predicted 1RM. Here’s the data for the squat (this time only showing since 2019-07, since I wasn’t really tracking set counts before that):
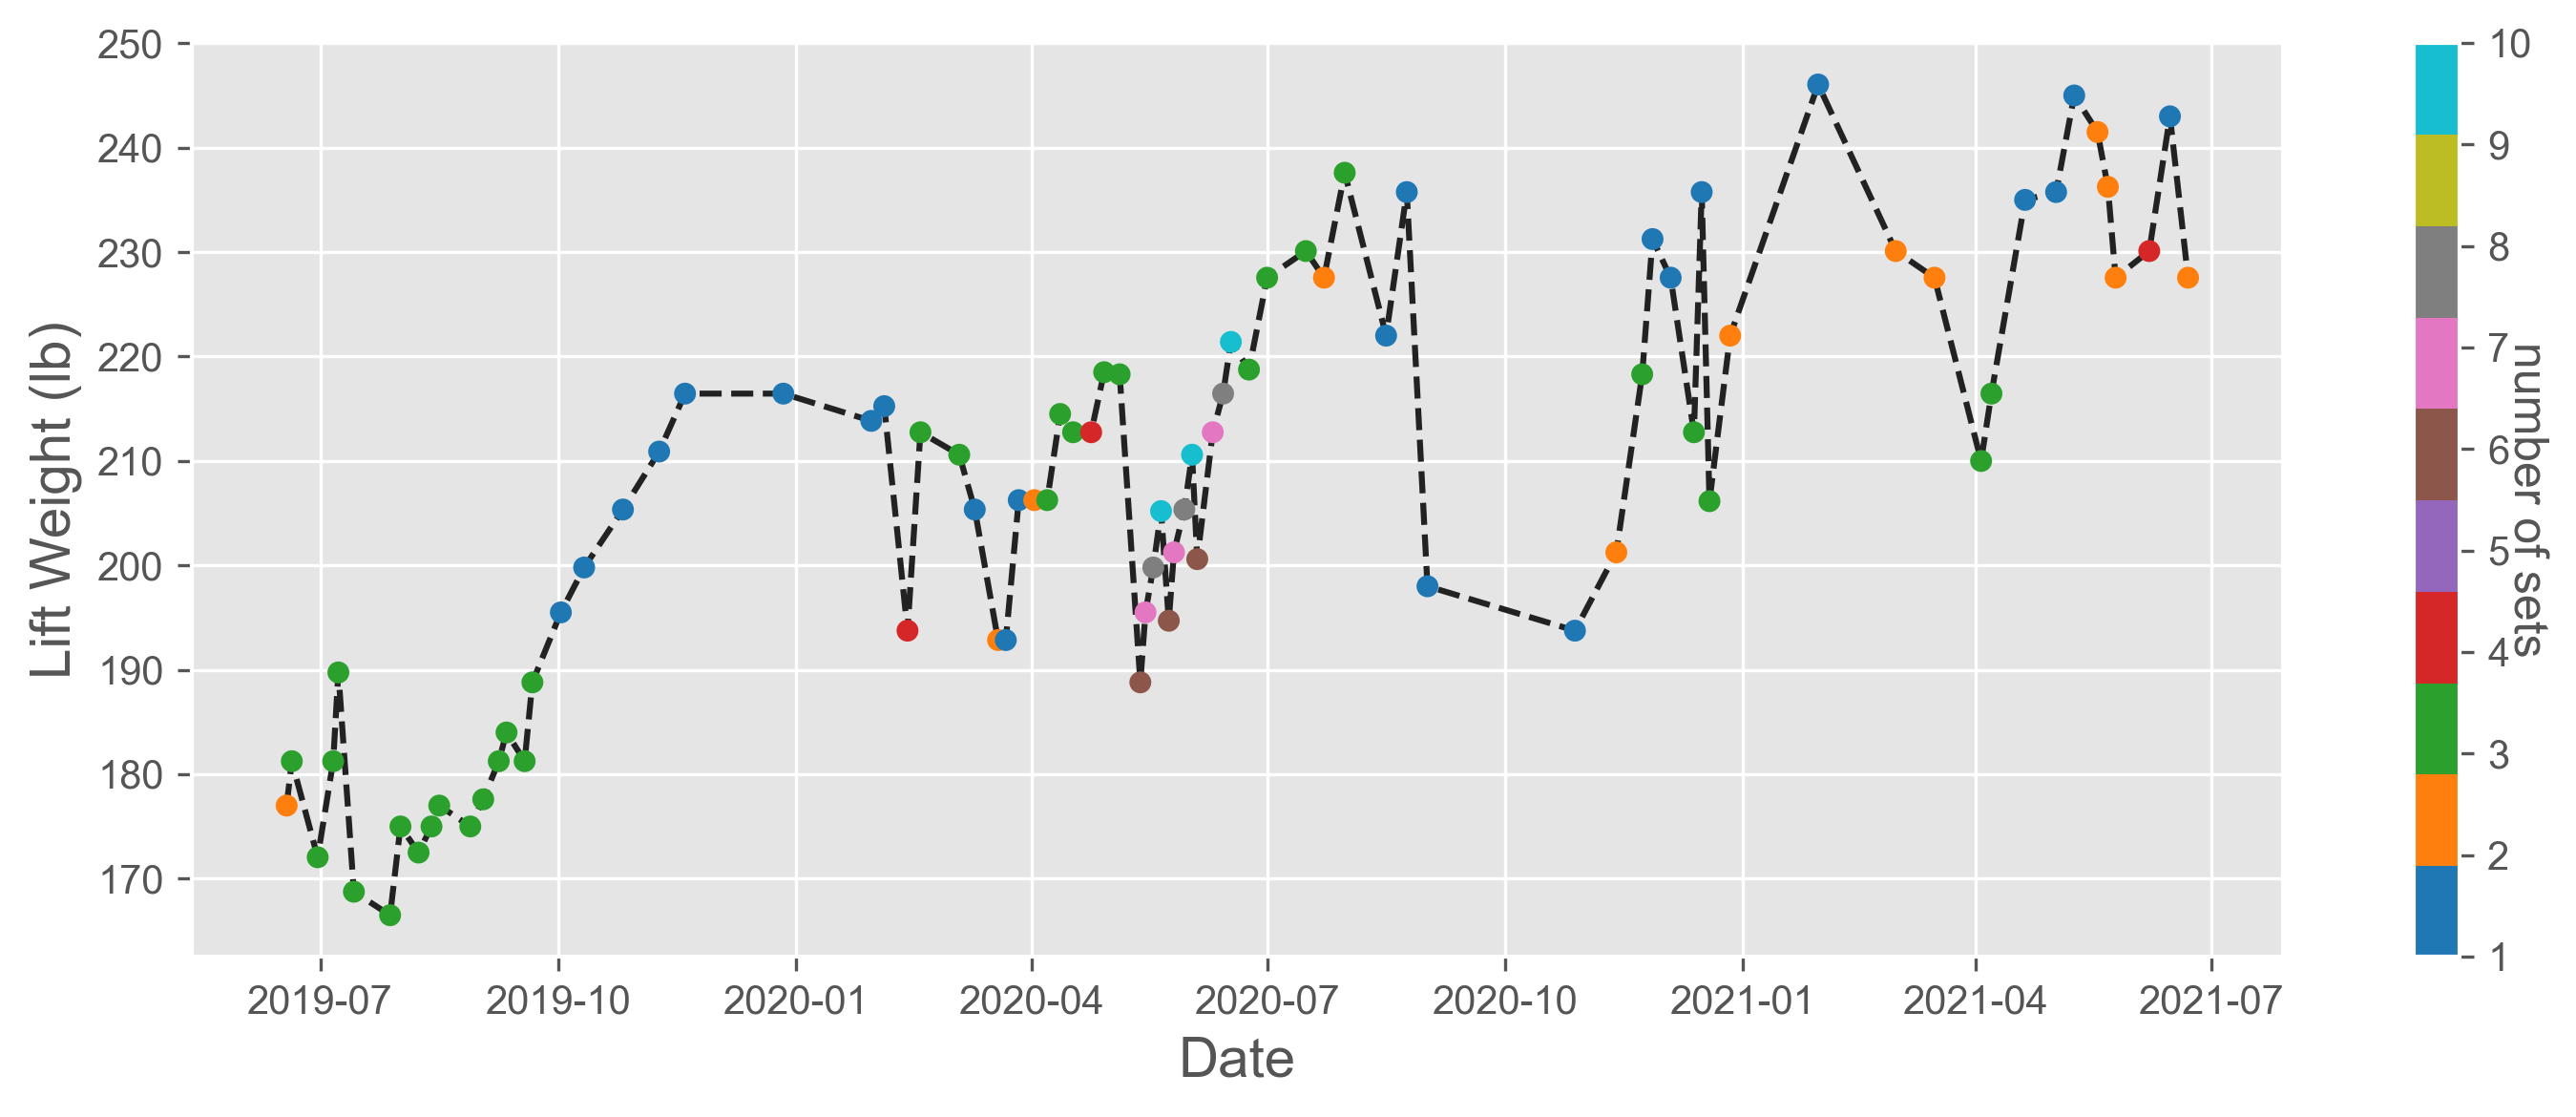
Some notable things here are the stretch from 2019-07 to 2019-10, when I would only do workouts with 3 sets (green points), apparently (I was running some Jeff Nippard program). In the stretch after that, I had my one max effort set per week (nSuns program), which brought good results. In that colorful stretch in May/June 2020, I was running the Smolov Jr program, which is a crazy high volume program where you start each week with a light 6x6 and end with a heavy 10x3. I made great progress with Smolov, even though I was running it for squat and bench simultaneously, which was pretty challenging. I want to try it again sometime soon. Recently, even though my squat numbers haven’t been steadily jumping, I’ve been doing 2+ sets at weights pretty close to my 1RM, which is something to be happy about.
Here’s the plot for bench:
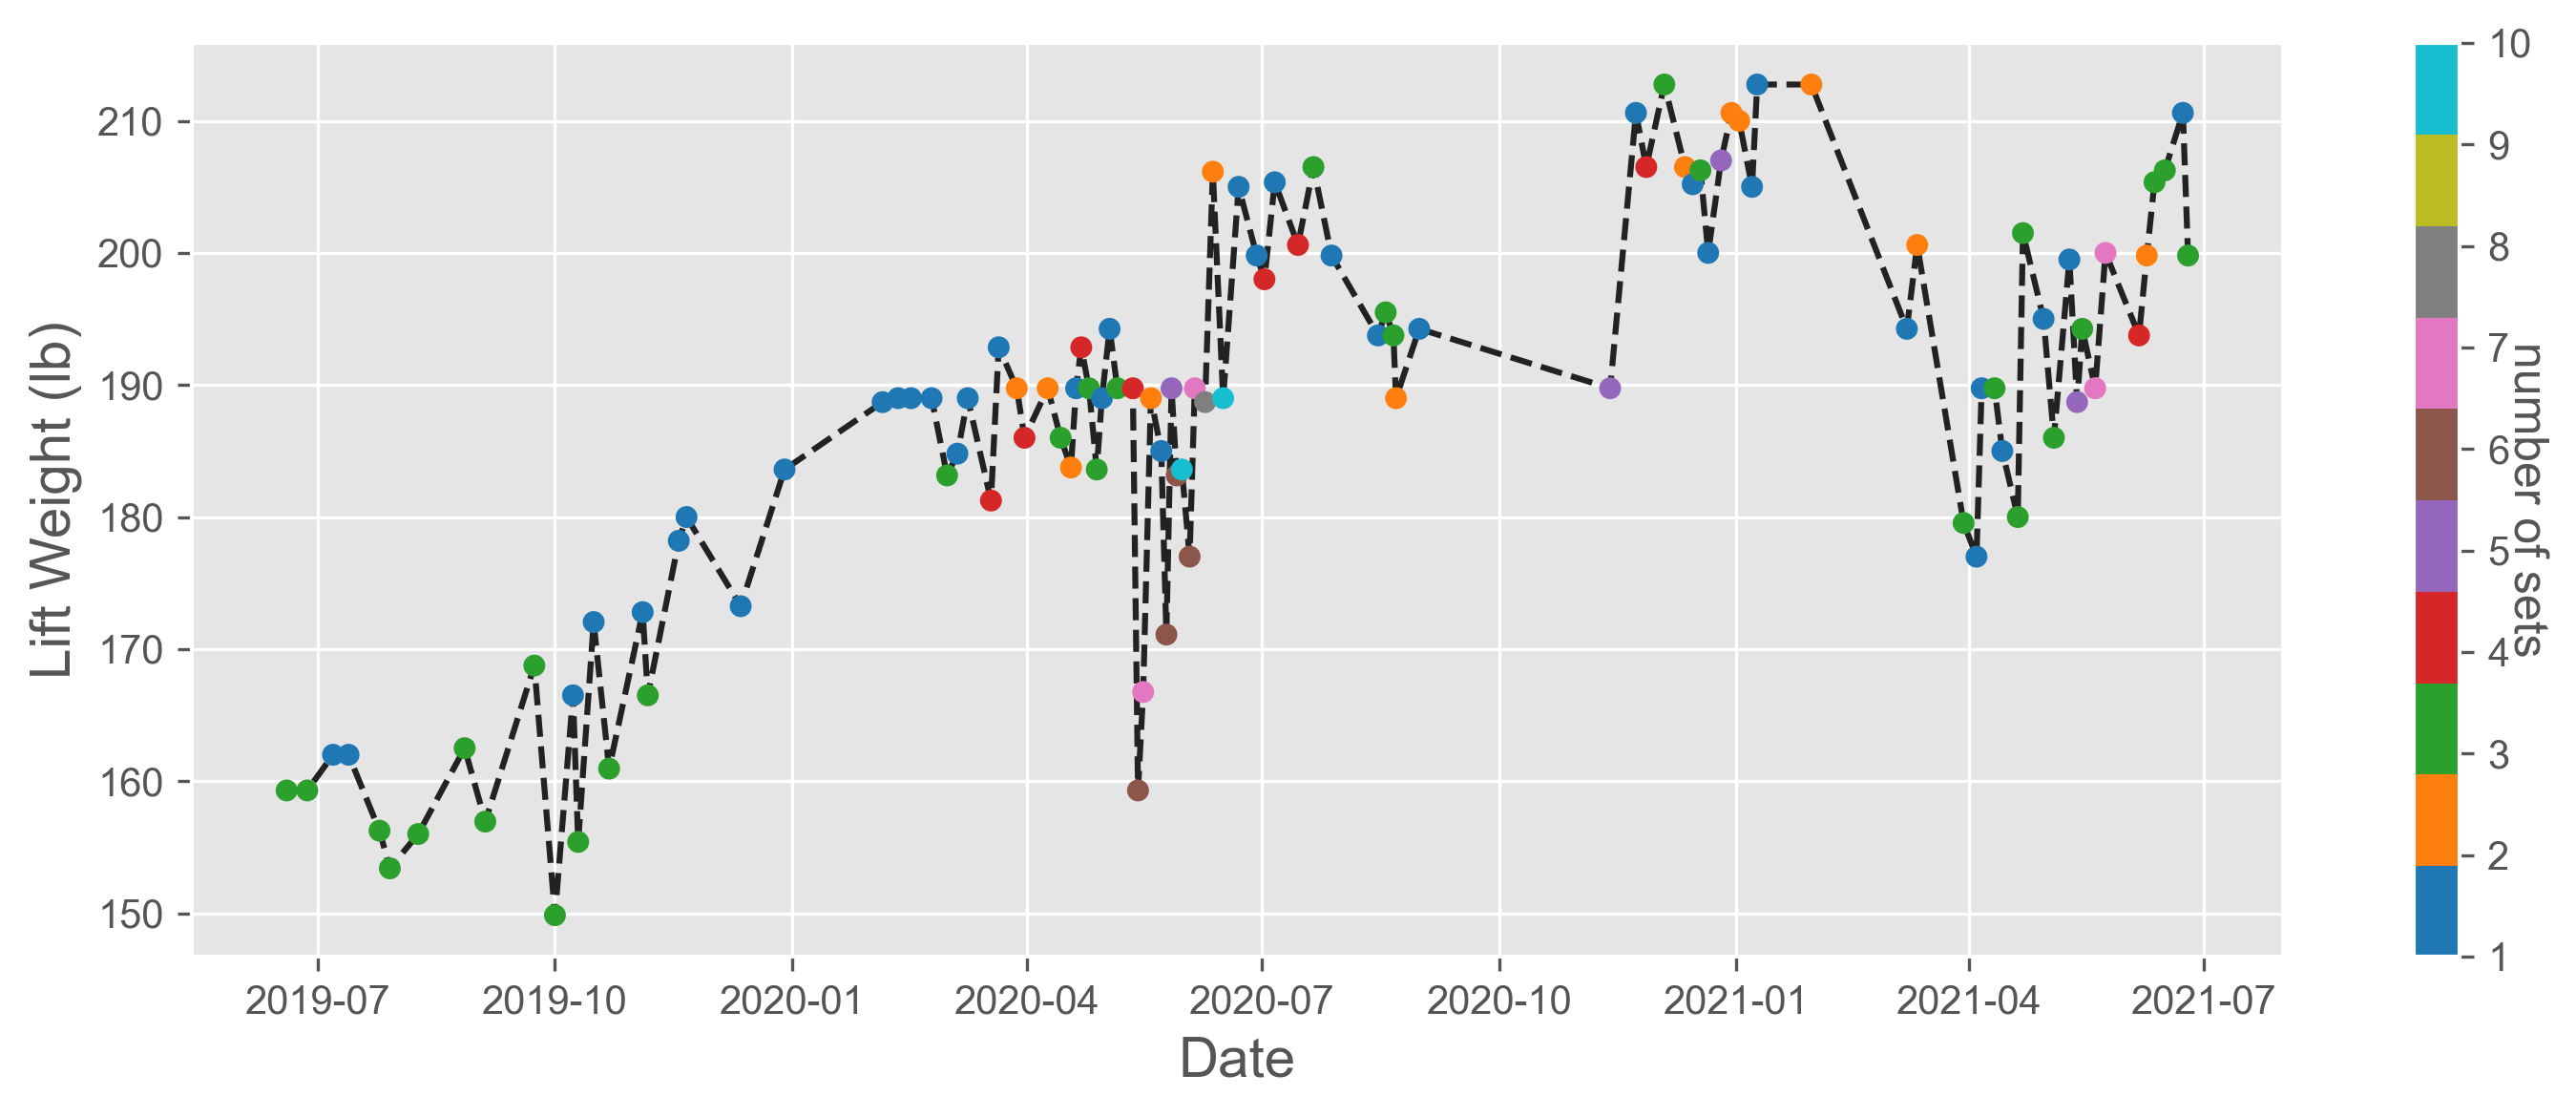
Not that much to say here. I’m excited that my tolerance for volume has been pretty high recently though, and I finally feel like I’m ready to hit some new maxes in the near future after several months at a 205-210ish 1RM. The goal is two plates, 225 lbs, by end of summer, which is about a 10-15 lb jump from the current state.
Finally, I was curious about how my “powerlifting total” had progressed over the years. The plots so far have shown the weights that I lift on each and every session, but that brings a lot of workout-to-workout variance with it. Once you’ve been lifting for a few months, you’re going to be moving a lot less than your max on most given workouts, because you have to manage fatigue in order to make longer-term progress.
However, I wanted to now look at how my max strength had progressed. So, for each of {squat, bench, deadlift}, I maintained a running max that was updated at every 2-week interval. I summed these running maxes to plot a cumulative value (orange), offering a sense of what my powerlifting total would’ve been at any given time. Alongside, I also plot the individual running maxes, and also bodyweight (in lbs) so you can get a sense of how strong I was pound-for-pound.
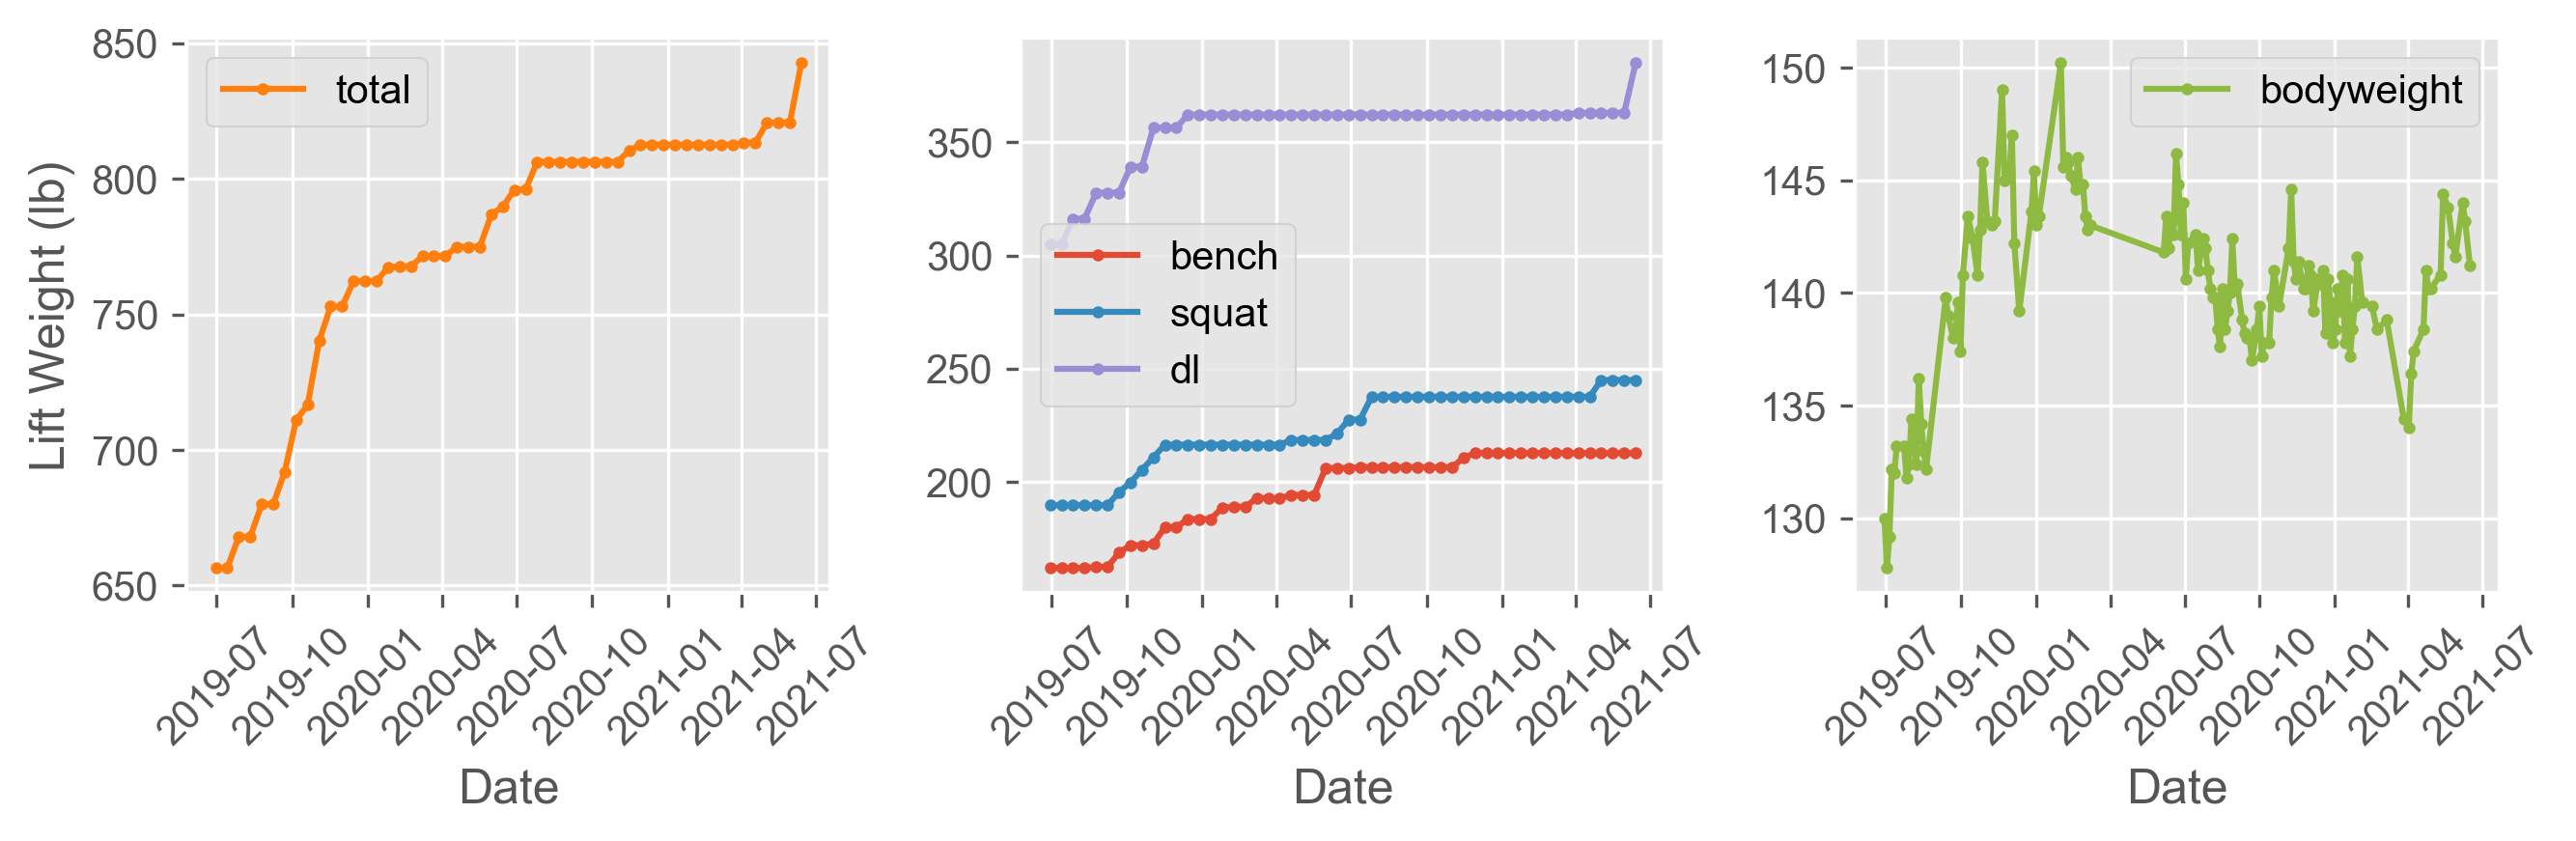
I start the graph at 2019-07, when some noob gains had brought me to a 650 total. I had to make my programming a bit smarter then, but I still had a lot of beginner progress to make. I put on about 100 pounds to my total by the start of 2020, due to strong progress in all three lifts. I added \~50 more pounds up to about 810 from the start of quarantine to the time I went back to Cambridge in Fall 2020, entirely due to squat and bench progress (I was deadlifting conventional at this time, so no progress on my max). Finally, I’ve added another \~40 pounds with my work in the last few months, thanks mostly to getting back into sumo deadlifting, and a bit of squat work as well. Meanwhile, my bodyweight jumped from 130 to 140 after a Fall 2019 bulk, and I’m still in the low 140s (though I hit 150 briefly thanks to my IAP 2020 Italy trip). Overall, my body composition has improved pretty significantly, as I’ve stayed essentially the same weight while putting on quite a bit of strength and muscle. I’m fairly happy with my 850 total at \~142 lbs, but my longer-term goal is to hit a 1000 pound total at <= 150 lbs by the time I graduate MIT (June 2022).
Anyway, I’m excited to keep logging my progress, and hopefully I’ve convinced you to start tracking your workouts as well if you don’t already. The data isn’t THAT deep, but there’s at least a bit of fun to be had.